
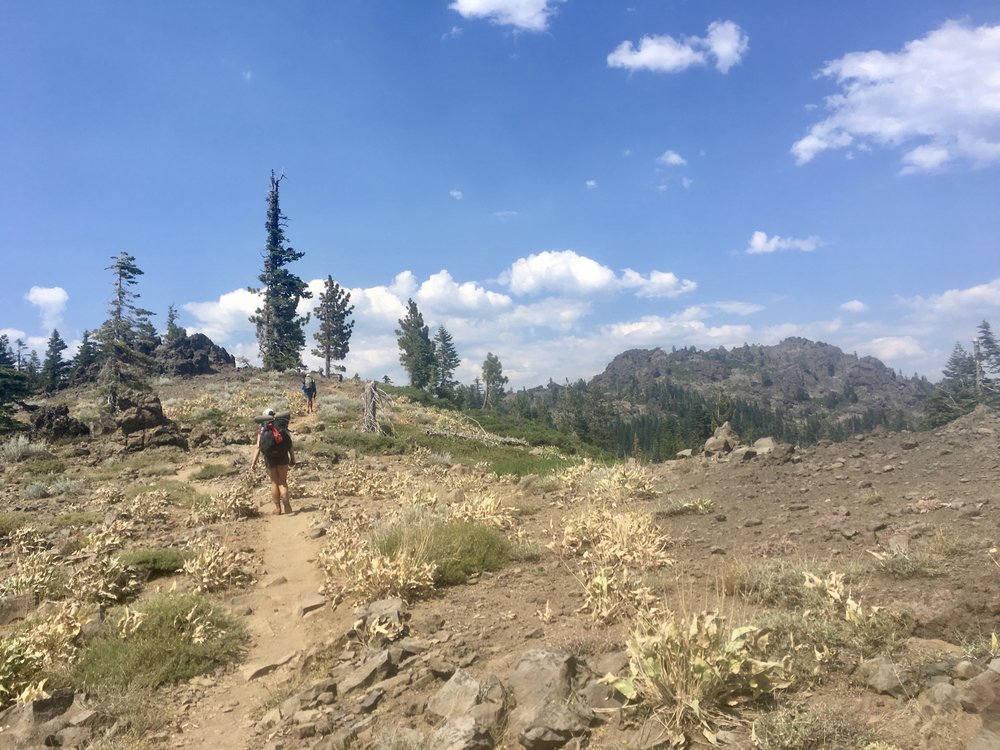
You can probably tell that I’m a pretty big fan of the outdoors from my decision to hike 1,833.3 miles of the Pacific Crest Trail last summer. But I’m an even bigger fan of numbers, statistics, and graphs. Don’t believe me? Check out this video I made highlighting daily metrics from my last semester of college. I’m a nerd, and I have no qualms about that part of my identity. I embrace it.
So, let’s jump right in.
Miles
Each day on the PCT can be categorized into three types: a zero, a near-o, and a full day. A zero is a day in which we didn’t hike any miles on the PCT. A near-o is a day in which we hiked less than 10 miles. Typically near-os were on days we were coming into or heading out of town. A full day of hiking is just what it sounds like. Here’s a breakdown of our days by type:

People have also asked me about our average daily mileage. This can be tough to answer since it varied a lot depending on which section of the trail we were hiking. Unfortunately, my partner and I had to start in Tehachapi, CA and skip most of the desert due to timing issues, but we did hike in every section of the trail, which can be divided into five sections: the desert, the Sierra Nevadas, Northern California, Oregon, and Washington. Each section presented drastically different terrain which greatly influenced our daily mileage.
Here’s a graph of our mileage in the desert:

As we were just starting out, we didn’t push ourselves too hard right out the gate and didn’t break 20 miles in this section. In the few days we hiked in the desert, we tried to hike early in the day when it was cooler. In the early afternoon, it wasn’t uncommon to spend a couple of hours in whatever shade we could find and chill out until it cooled down. That being said, we maintained a higher daily mileage than we predicted we would be able to do starting out. Our average full day of hiking in the desert was 16.9 miles.

Here’s a graph of our mileage in the Sierra Nevadas:
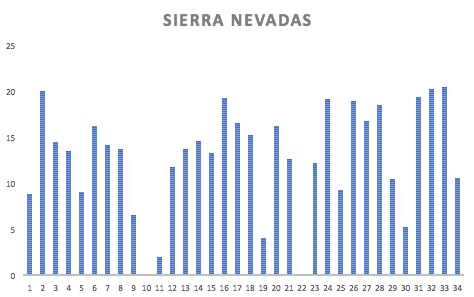
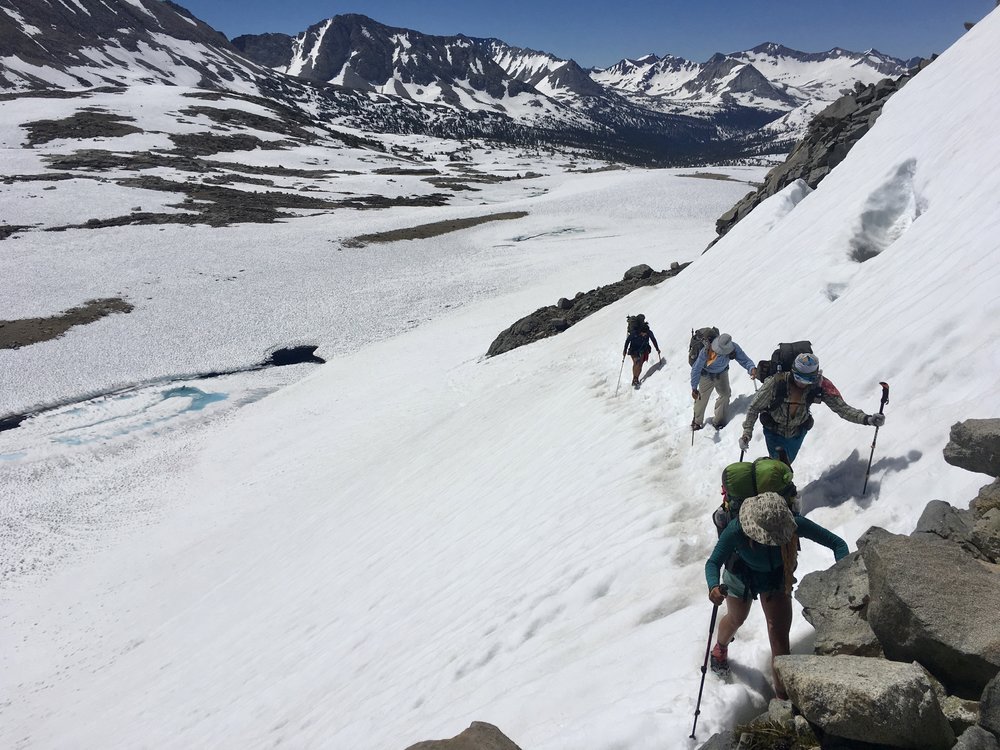
The Sierra section was a beast. Due to a record snow fall that year, the mountain passes were covered with snow and the creeks were swollen and raging. These conditions caused us to drop in daily mileage despite hiking for 12–14 hours a day. Snow slows you down. Way down. We also had to spend time going off trail to find safer spots to cross dangerous creeks, as well as literally finding the trail underneath all that snow. Our average full day of hiking in the Sierra Nevadas was 15.4 miles.
Here’s a graph of our mileage in Northern California:
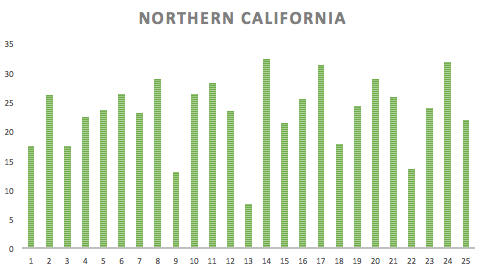
Coming out of the Sierra section, we knew that we had to make up for lost time if we were going to finish before winter started in Washington. So we kicked it into high gear. My team and I fine-tuned our strategy and aimed to hit around 25 miles a day until we reached Oregon. It was hot, hilly, and brutal. But we made it — a day earlier than our schedule, in fact. Our average full day of hiking in Northern California was 24.0 miles.
Here’s a graph of our mileage in Oregon:

Oregon is known to be somewhat of an easier section on the PCT due to the mild elevation changes. When it’s flat, you walk faster. A lot faster. This is when we started to creep up into the 30s. Unfortunately, we had to skip around 140 miles of Oregon due to wildfires, but we walked all that of the state we could. Our average full day of hiking in Oregon was 27.0 miles.

Here’s a graph of our mileage in Washington:
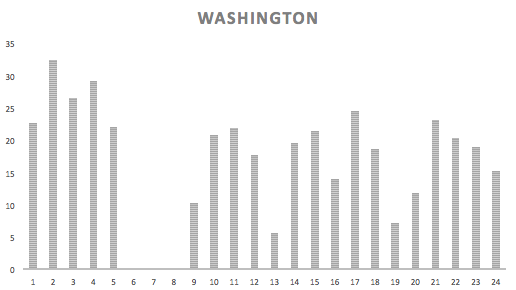
By the time we reached Washington, we were on track to finish just before October; however fires thwarted our hike again. In the middle of the state, we were forced to skip another 110 miles the PCT, putting us way ahead of schedule. With this in mind, we made the conscious decision to slow down, wake up later, and take longer breaks to enjoy the last bits of the trail. This decision, along with the hillier terrain led us to drop slightly in daily mileage n Washington. Our average full day of hiking in Washington was 21.2 miles.

Miles Summary
- Total number of zeros: 12
- Total number of near-os: 24
- Total full days of hiking: 88
- Average mileage of near-os: 7.0 miles
- Average mileage of full days: 20.5 miles
- Shortest day: 2.0 miles
- Longest day: 32.4 miles
- Total PCT miles logged: 1,833.3 miles
- Total non-PCT miles logged: 111.5 miles (whenever we had to hike miles not on the PCT, due to finding safer spots to cross creeks, road walks, super far water sources, etc., I roughly estimated those miles)
- Grand total miles logged: 1,944.8 miles
Towns
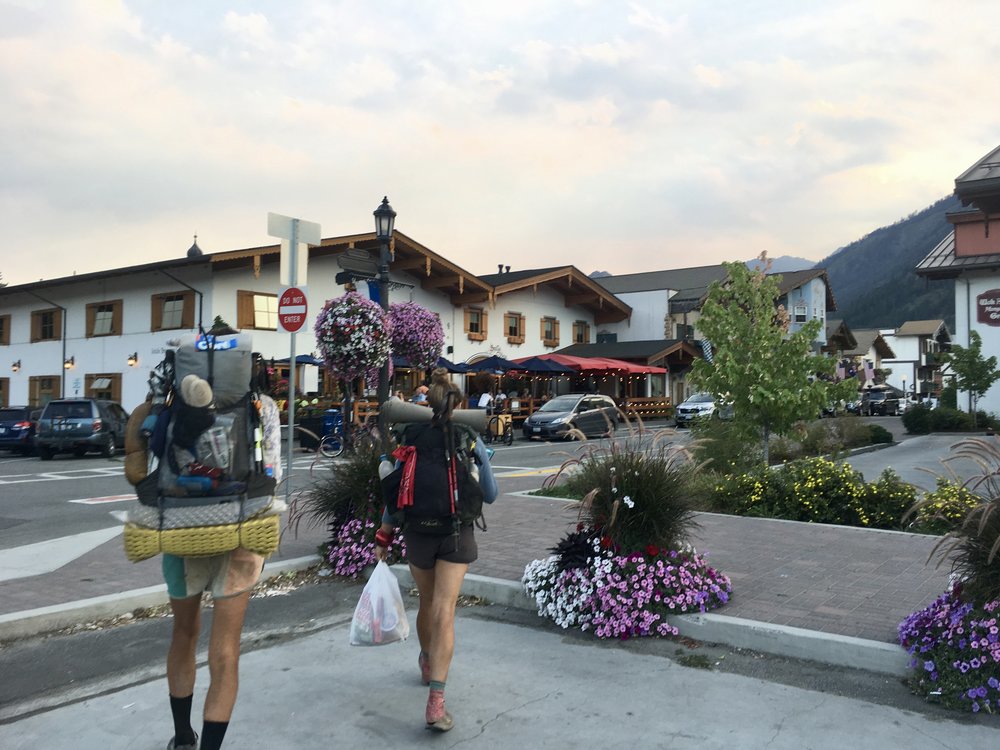
We didn’t completely escape civilization while on the PCT. Town stops were ironically a major part of the trail experience. We went into town to shop for food, pick up packages, clean ourselves, and treat ourselves to food that didn’t need to be rehydrated.
Towns Summary
- Total number of town stops: 20 stops
- Nights spent at a hotel: 7 nights
- Nights spent at a hostel: 3 nights
- Nights spent at an RV park: 3 nights
- Nights spent at a friend’s home: 11 nights
- Nights spent at a campground in a town: 6 nights
- Cycles of laundry: 15 cycles
- Showers: 28 showers
- Breakfasts bought in town: 16 breakfasts
- Lunches bought in town: 15 lunches
- Dinners bought in town: 13 dinners
Hitchhiking
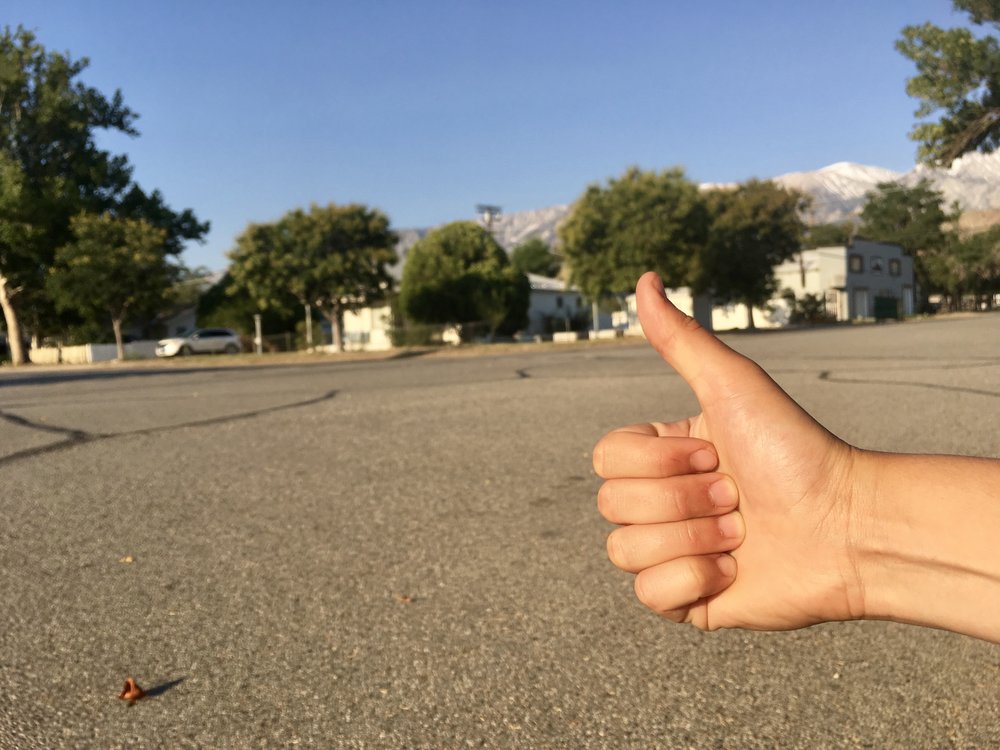
While hiking clearly makes up most of the PCT experience, hitchhiking is a significant means of transportation on trail. The trail does not lead directly into a town (for the most part), so hikers have to find other ways to get to civilization in order to resupply their food. While a few hikers opt to travel solely by foot, most end up relying on strangers who pull over to the sight of an outstretched thumb. We got rides from all sorts of people including locals, international tourists, truckers, van dwellers, and even a guy in a Camaro.
I must note that my experience hitchhiking as a woman is vastly different from what my male hiker friends underwent. Women, especially younger women like myself, have no trouble at all hitching rides. Drivers openly admitted that they were more likely to pick up hikers if there was a woman in the group. Additionally noteworthy is that the vast majority of drivers offering rides were men in my experience.
Hitchhiking Summary
- Total number of rides hitched: 21 hitches
- Total distance hitched: 485.4 miles
- Gender breakdown of drivers: 81% male drivers, 19% female drivers
- Longest distance hitched: 112 miles
- Shortest distance hitched: 1.2 miles
- Average distance hitched: 23.1 miles
- Longest wait for a ride: ~90 minutes
- Shortest wait for a ride: ~2 minutes
